Introduction
Dashboards are one of the most popular things to convert to PDF in a .NET application — quarterly reports, KPI summaries, customer-facing analytics, scheduled email attachments. The catch is that modern dashboards are built with JavaScript charting libraries like Chart.js, and JavaScript charts don't exist when the page first loads. They get painted after the canvas elements are wired up, animations have run, and any asynchronous data fetches have resolved.
If your PDF tool just navigates to the page and captures it, you'll end up with empty canvases, half-drawn bars, or charts frozen mid-animation. This is the single most common cause of "the PDF looks broken" tickets when teams move from screen-only dashboards to scheduled exports.
In this article we'll build a small Chart.js sales dashboard, render it with CobaltPDF, and walk through four different wait strategies — showing exactly what each one captures, and which one to reach for in production.
Project setup
Create a new console app and install the CobaltPDF NuGet package:
dotnet new console -n DashboardExporter
cd DashboardExporter
dotnet add package CobaltPdf
CobaltPDF bundles Chromium automatically — there's nothing else to install.
Step 1 — The dashboard
Here's a realistic dashboard: four KPI cards, a grouped bar chart for monthly revenue, a doughnut for regional split, a line chart for weekly active customers, and a horizontal bar chart for top product lines. Crucially, it fetches its data asynchronously after the page loads — mimicking a real app that pulls from an API.
<script src="https://cdn.jsdelivr.net/npm/chart.js@4.4.1/dist/chart.umd.min.js"></script>
<script>
  // Simulate a real API call — data arrives several seconds after page load.
  function fetchDashboardData() {
    return new Promise(resolve => {
      setTimeout(() => resolve({
        monthly: { labels: ['Jan','Feb','Mar'], q1: [445000,468000,510000], prevYear: [398000,412000,455000] },
        regions: { labels: ['NA','EMEA','APAC','LATAM'], data: [620000,380000,290000,130000] },
        // ...weekly, products
      }), 5000);
    });
  }

  (async () => {
    const data = await fetchDashboardData();
    new Chart(document.getElementById('revenueChart'), { /* ...bar config */ });
    new Chart(document.getElementById('regionChart'),  { /* ...doughnut */ });
    new Chart(document.getElementById('activeChart'),  { /* ...line */ });
    new Chart(document.getElementById('productChart'), { /* ...horizontal bar */ });
  })();
</script>DOMContentLoaded. They fetch from APIs, hydrate from
IndexedDB, or wait for user-specific session data. The 5-second
setTimeout exaggerates that pattern so the differences between wait
strategies are obvious. In production, you'd see the same issues at 200–800ms.
Save the file in your project directory. We'll feed its file:// URL to
CobaltPDF.
Step 2 — The naive render (broken)
Let's start with the simplest possible call — just point CobaltPDF at the dashboard and ask for a PDF, with a tiny fixed delay to simulate the "just give it a moment" approach:
using CobaltPdf;

var url = new Uri(Path.GetFullPath("dashboard.html")).AbsoluteUri;

await new CobaltEngine()
    .WithLandscape()
    .WithPrintBackground()
    .WithWaitStrategy(WaitOptions.ForDelay(TimeSpan.FromMilliseconds(100)))
    .RenderUrlAsPdfAsync(url)
    .SaveAsAsync("dashboard-naive.pdf");
Here's what comes out:
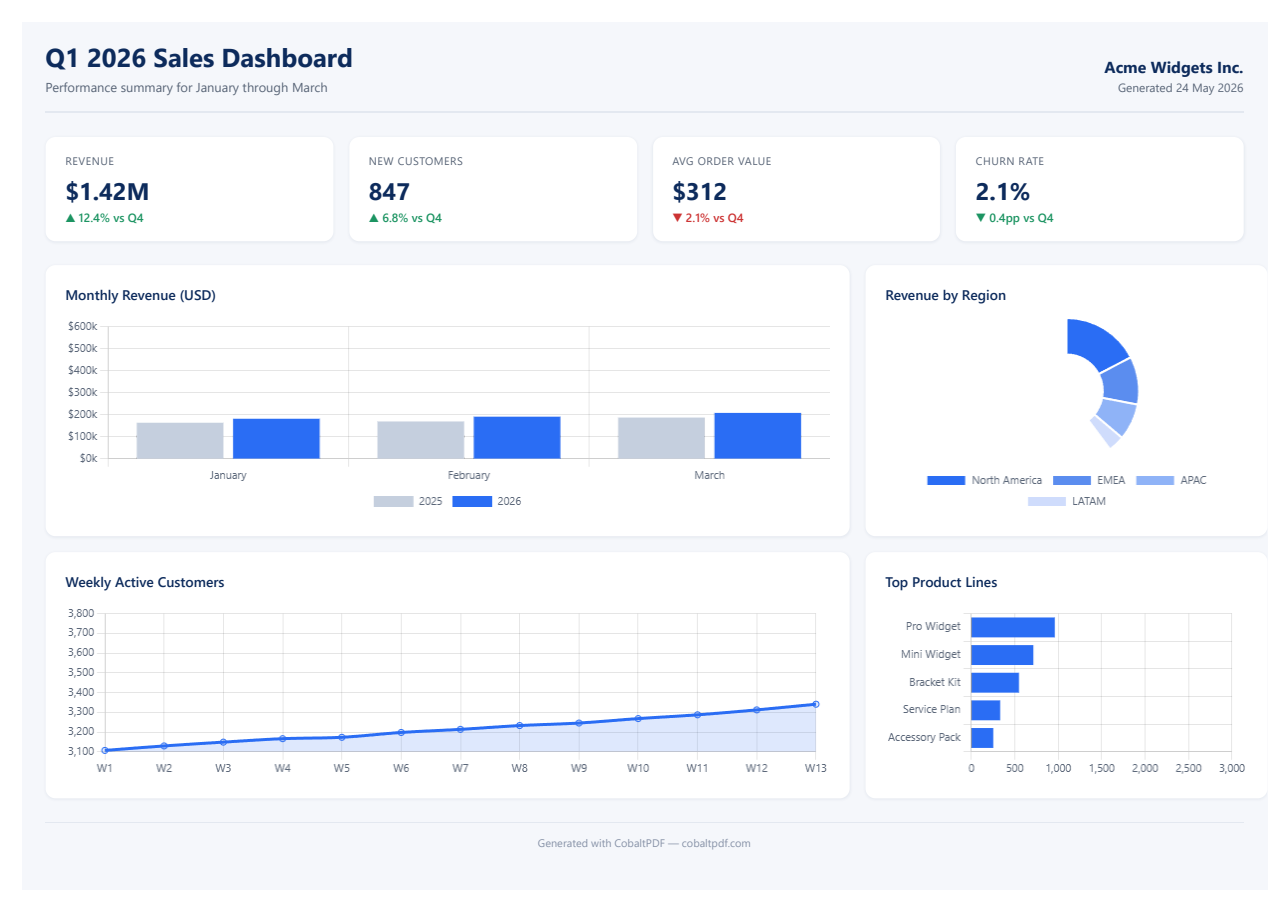
Every chart is wrong. The KPI cards (which are static HTML) render fine, but the
Chart.js canvases are caught mid-animation. The capture happened before the data
arrived, before new Chart(...) ran, and before the entry animation
completed. We need a smarter signal.
Step 3 — Wait for network idle (still broken)
The most common first attempt is to wait for the network to go quiet — the idea being "if nothing is loading, the page must be ready." This is CobaltPDF's default strategy:
await new CobaltEngine()
    .WithLandscape()
    .WithPrintBackground()
    .WithWaitStrategy(WaitOptions.DefaultNetworkIdle)
    .RenderUrlAsPdfAsync(url)
    .SaveAsAsync("dashboard-networkidle.pdf");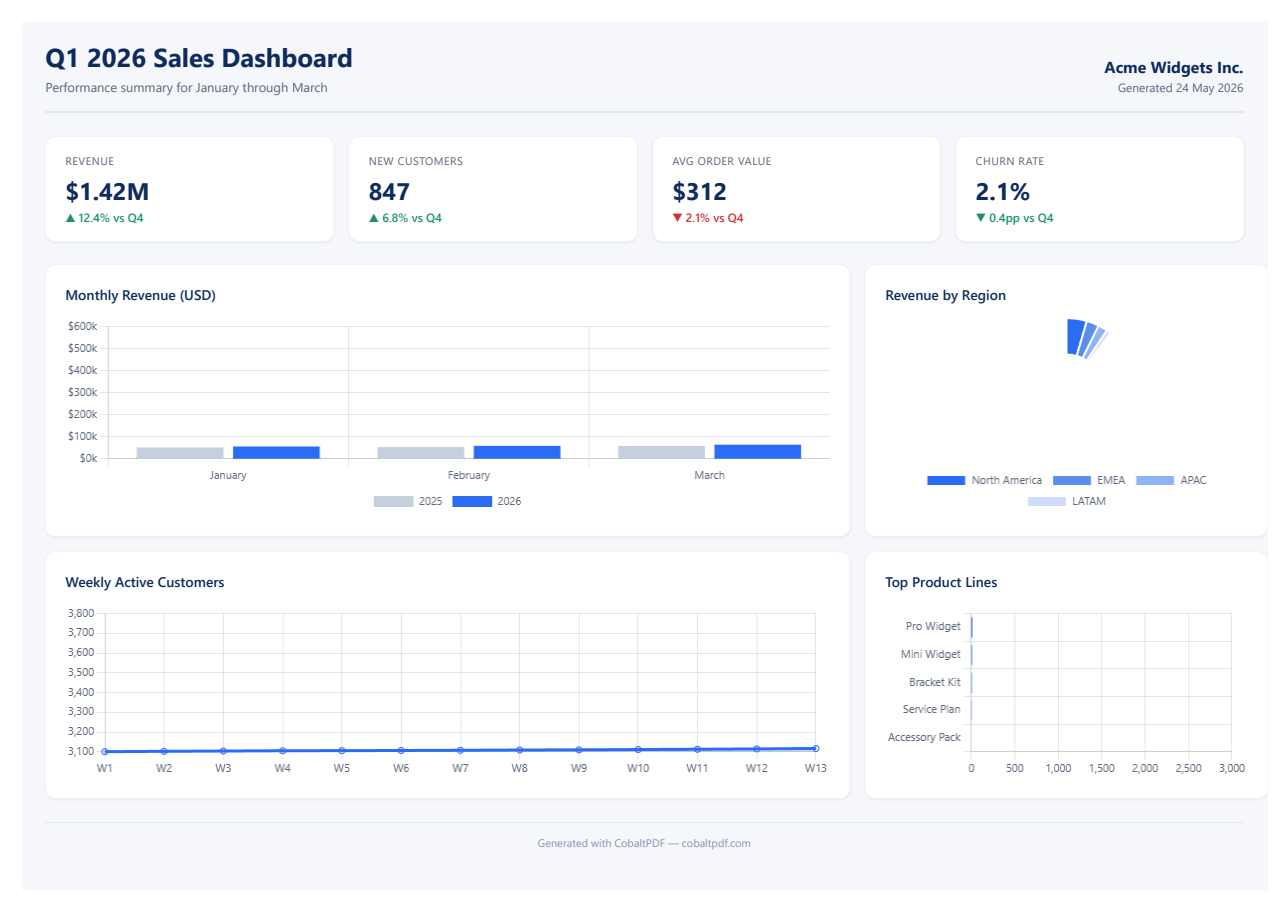
This is actually worse than the naive render. Here's why: the page itself
loads in a few hundred milliseconds (HTML + the Chart.js CDN script). The network
then goes quiet because our data "fetch" is a pure JavaScript
setTimeout — no actual HTTP traffic. CobaltPDF sees 500ms of
silence and fires the capture, long before the data arrives.
Step 4 — Wait for a JavaScript flag
If network silence isn't a reliable signal, we need to ask the page itself when it's
ready. WaitOptions.ForJavaScript polls a JS expression until it returns
truthy. We set a flag after every Chart.js animation has completed:
await new CobaltEngine()
    .WithLandscape()
    .WithPrintBackground()
    .WithCustomJS(@"
        (function () {
            let drawn = 0;
            const total = Object.keys(Chart.instances).length;
            Object.values(Chart.instances).forEach(chart => {
                chart.options.animation = {
                    ...(chart.options.animation || {}),
                    onComplete: () => {
                        drawn++;
                        if (drawn >= total) window.chartsReady = true;
                    }
                };
                chart.update();
            });
        })();
    ")
    .WithWaitStrategy(WaitOptions.ForJavaScript(
        "window.chartsReady === true",
        TimeSpan.FromSeconds(15)))
    .RenderUrlAsPdfAsync(url)
    .SaveAsAsync("dashboard-jsexpression.pdf");
WithCustomJS injects our script into the page after the document is
ready. It walks every Chart.instances entry, attaches an
onComplete callback to each one's animation config, and sets
window.chartsReady = true once they've all fired. CobaltPDF polls the
expression every few milliseconds until it returns true, then captures.
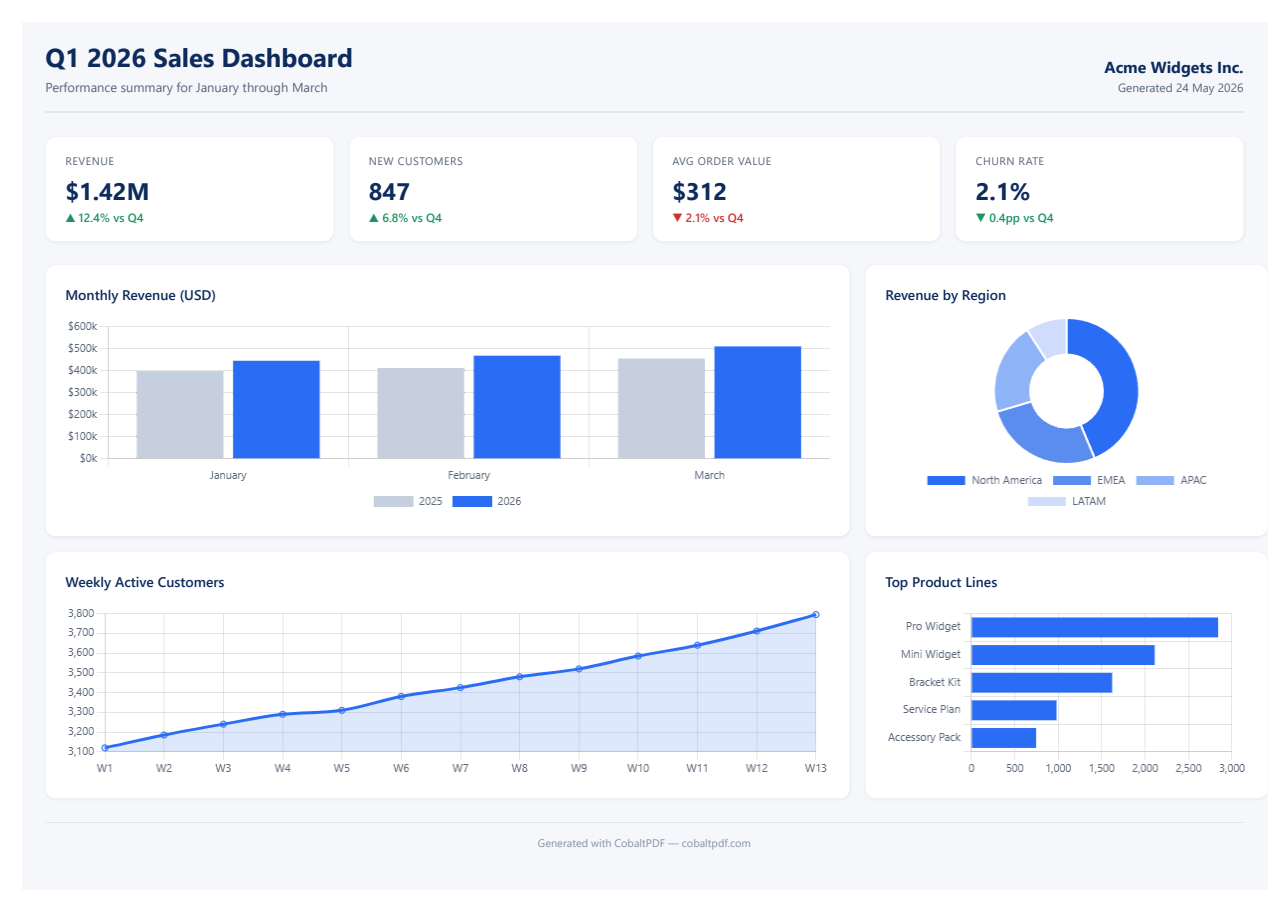
window.chartsReady catches every chart fully rendered — bars at full height, doughnut complete, line at its real peak of 3,795.This works reliably. The 15-second timeout is a safety net — if charts never finish (broken script, missing data), the call throws instead of hanging forever.
document.querySelectorAll('.chart').length === 4,
window.app.allDataLoaded, whatever fits.
Step 5 — The signal pattern (recommended)
Polling works, but it's still a guess: CobaltPDF checks the expression every few
milliseconds and might capture a tiny moment after the last chart finishes. For
precise control, CobaltPDF exposes a built-in callback —
window.cobaltNotifyRender() — that you call from JavaScript the
instant the page is ready. The renderer waits for that signal:
await new CobaltEngine()
    .WithLandscape()
    .WithPrintBackground()
    .WithCustomJS(@"
        (function () {
            let drawn = 0;
            const total = Object.keys(Chart.instances).length;
            Object.values(Chart.instances).forEach(chart => {
                chart.options.animation = {
                    ...(chart.options.animation || {}),
                    onComplete: () => {
                        drawn++;
                        if (drawn >= total) window.cobaltNotifyRender();
                    }
                };
                chart.update();
            });
        })();
    ")
    .WithWaitStrategy(WaitOptions.ForSignal(TimeSpan.FromSeconds(15)))
    .RenderUrlAsPdfAsync(url)
    .SaveAsAsync("dashboard-signal.pdf");
The script is almost identical to the previous one — we just swap
window.chartsReady = true for window.cobaltNotifyRender(),
and use WaitOptions.ForSignal instead of
ForJavaScript. The result is the same pixel-perfect PDF, but the
capture happens the moment your code says so — no polling, no guesswork.
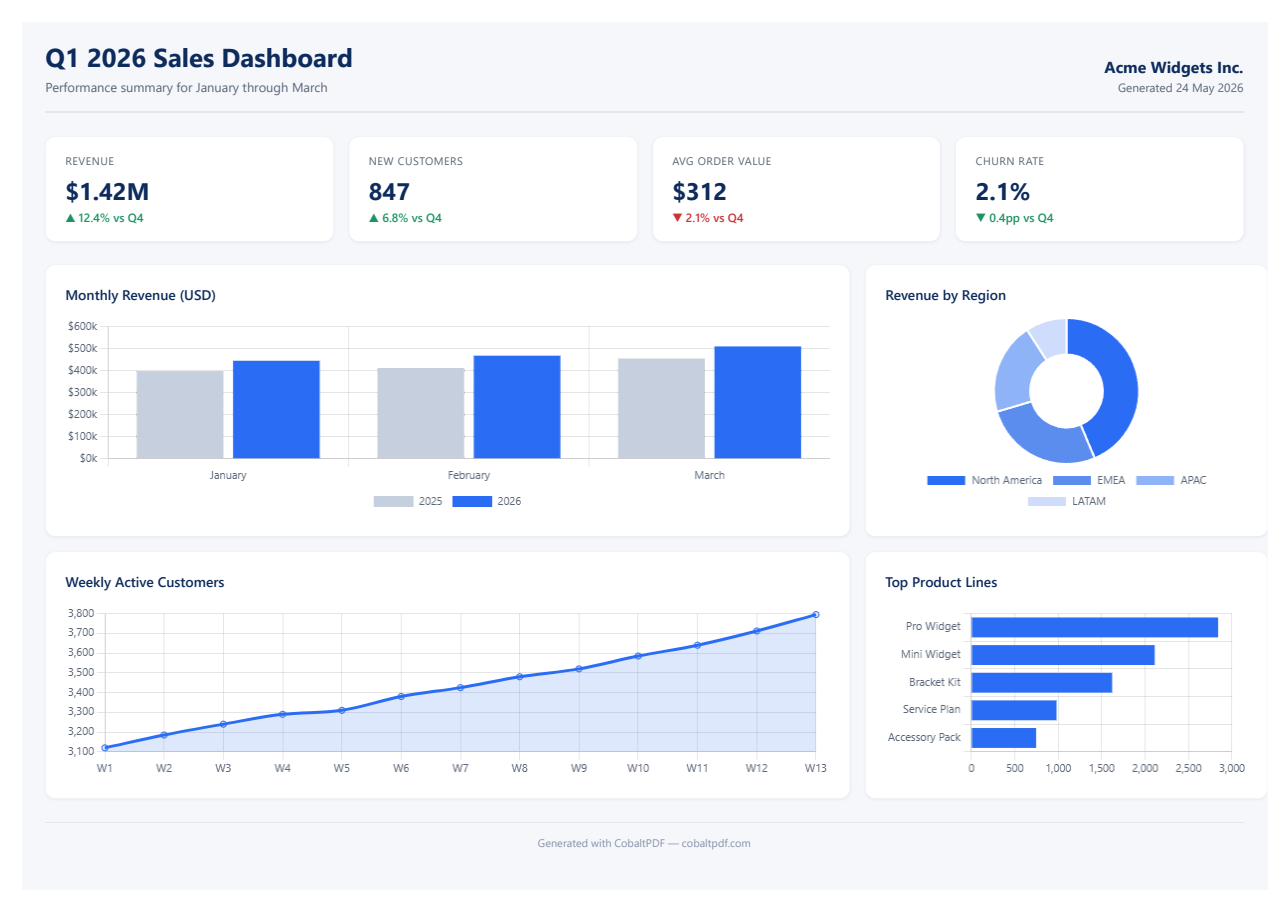
cobaltNotifyRender() from your
own success paths — after a fetch resolves, after a worker posts back,
whenever you know "done means done"). Use the JS expression pattern when
you're rendering a third-party page and have to infer readiness from outside.
Putting it all together
Here's the production-ready snippet combining the signal pattern with metadata, sensible margins, and a footer for the page number:
using CobaltPdf;

var url = new Uri(Path.GetFullPath("dashboard.html")).AbsoluteUri;

var readyScript = @"
    (function () {
        let drawn = 0;
        const total = Object.keys(Chart.instances).length;
        Object.values(Chart.instances).forEach(chart => {
            chart.options.animation = {
                ...(chart.options.animation || {}),
                onComplete: () => {
                    drawn++;
                    if (drawn >= total) window.cobaltNotifyRender();
                }
            };
            chart.update();
        });
    })();
";

var footer = @"
    <div style='width:100%; font-size:9px; color:#888;
                padding:6px 24px; text-align:right;'>
        Page <span class='pageNumber'></span>
        of <span class='totalPages'></span>
    </div>";

await new CobaltEngine()
    .WithLandscape()
    .WithPrintBackground()
    .WithMargins(new MarginOptions(0.2, MarginUnit.Inches))
    .WithFooter(footer)
    .WithMetadata(m =>
    {
        m.Title  = "Q1 2026 Sales Dashboard";
        m.Author = "Acme Widgets Inc.";
    })
    .WithCustomJS(readyScript)
    .WithWaitStrategy(WaitOptions.ForSignal(TimeSpan.FromSeconds(15)))
    .RenderUrlAsPdfAsync(url)
    .SaveAsAsync("dashboard-final.pdf");
That's the whole thing. The page renders identically to what your users see in the browser — same fonts, same colors, same spacing — with all charts fully painted and embedded as crisp vector graphics in the PDF.
Summary
Four ways to render a Chart.js dashboard to PDF — only two of them actually work:
Fixed delay
Brittle. Wins the race sometimes, loses it under load or slow CDNs. Avoid for anything you care about.
Network idle
Fine for static pages. Fires too early for charts that depend on JavaScript work after the network goes quiet.
JavaScript expression
Reliable. Polls a flag in the page until it's truthy. Use when rendering pages you don't control.
Signal pattern
The recommended approach. Call window.cobaltNotifyRender() from your own success paths — explicit and precise.
Ready to try it yourself?